ATLAS Transcriptional Signatures
We design custom transcriptional signatures to encode exactly the biological content that you want to know about your cells
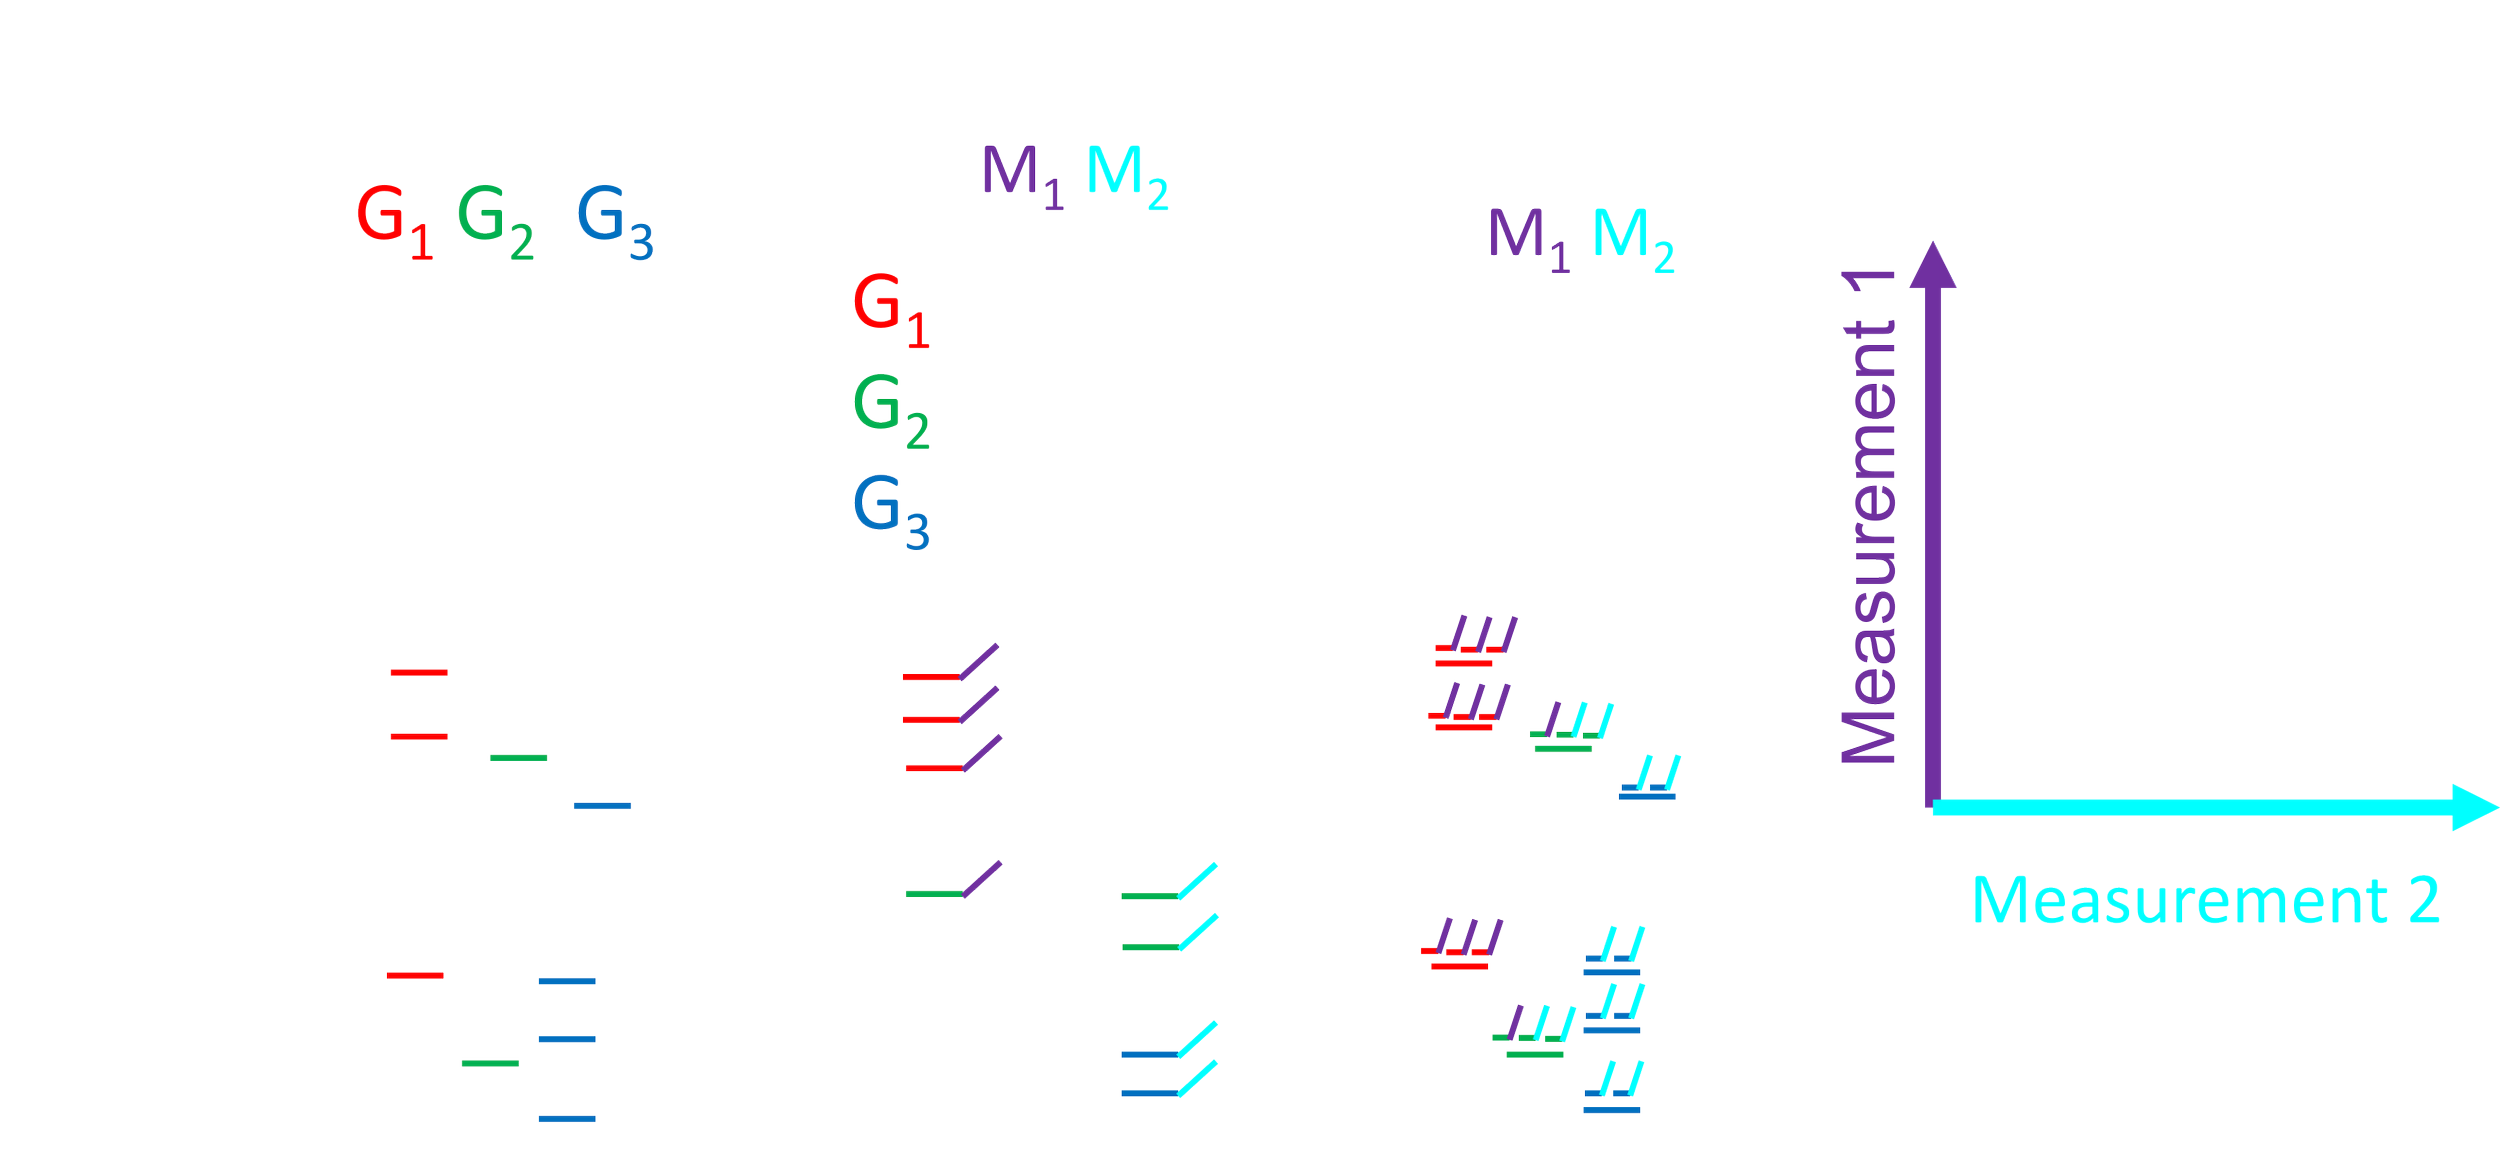
Design
We use scRNAseq to design transcriptional signatures (Weighted Sums of Gene Expression) optimized to contain exactly the information you want
Cell Type Label
Active Transcriptional Programs
Gene Expression

Measure
We measure these transcriptional signatures with fluorescence in situ hybridization. Optimizing our staining protocol to eliminate off target signal and background.
Decode
We perform the same projection on scRNAseq data as we did inside of the cells. We then harmonize the datasets and map information from the scRNAseq data onto our spatially measured cells.
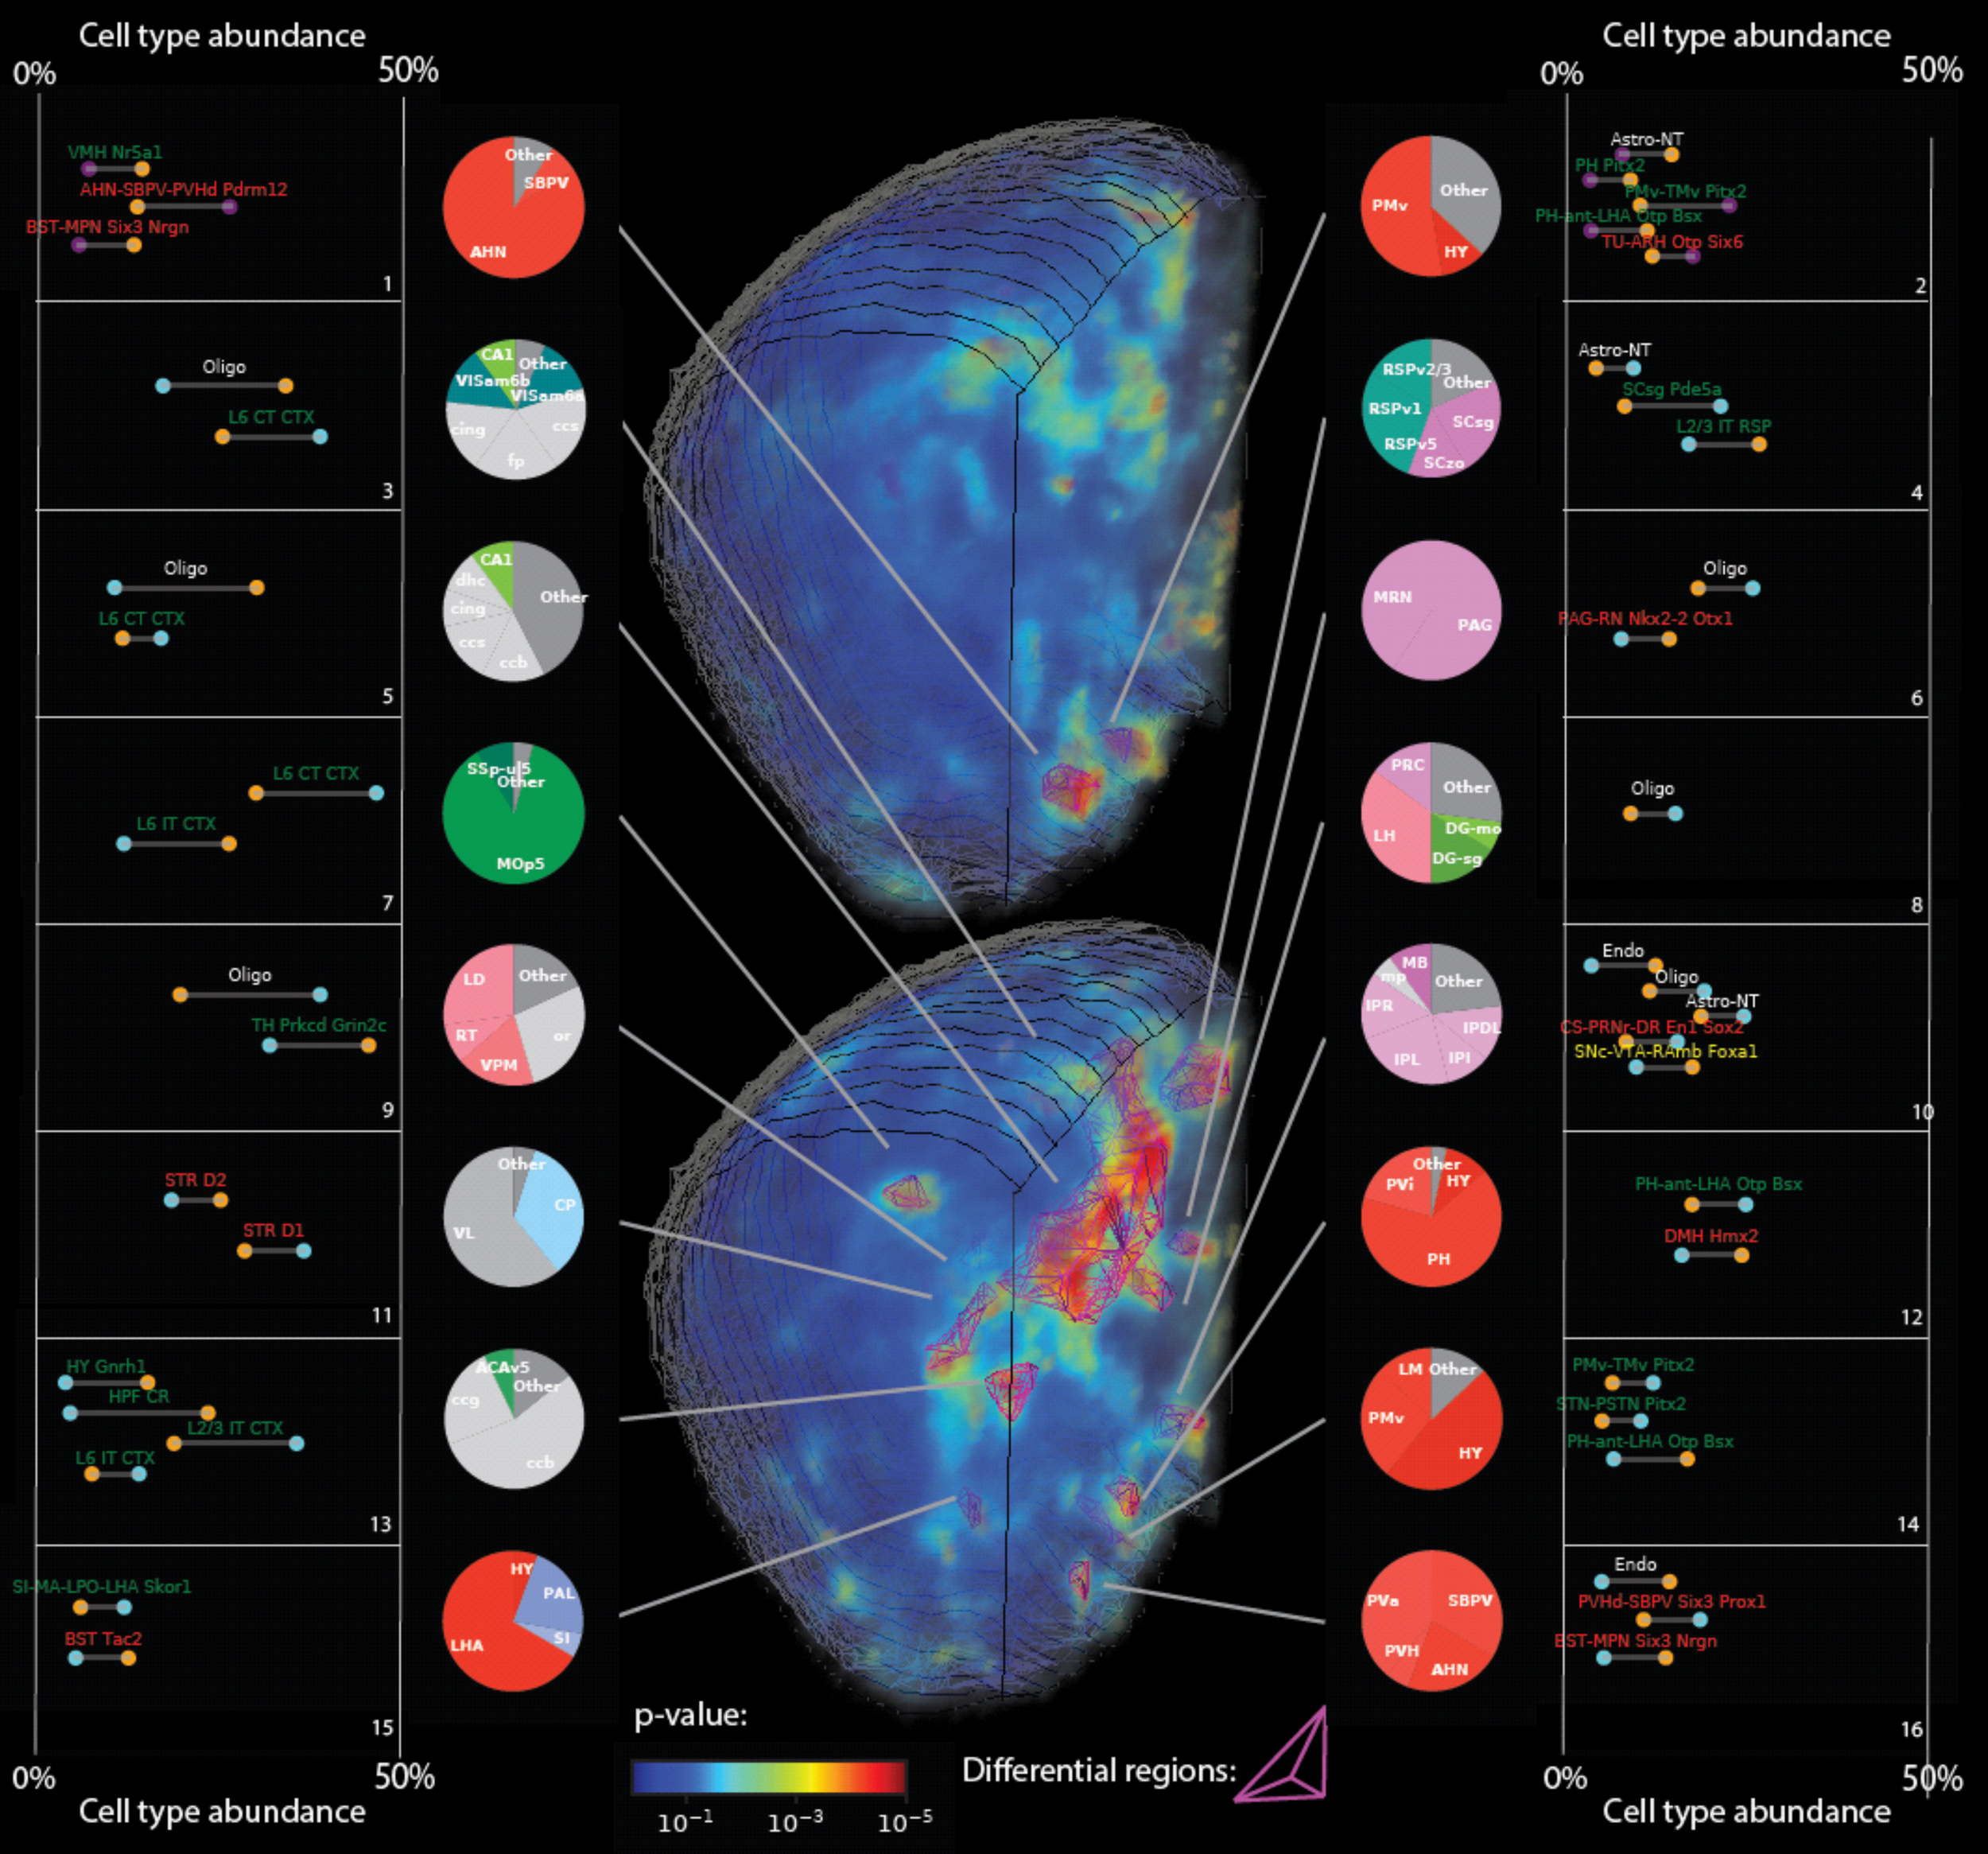

Discover
Use that scale to answer questions previously unanswerable about the spatial organization of life. For more details read our preprint